Usage
The Forecaster allows processing an analog method based on the latest available NWP outputs or for a given date. The real-time forecast calculation can be performed by a standard computer without specific resources. The forecast can be executed on demand through a graphical user interface (GUI) or can be automated through the use of a command-line interface (CLI). Both aspects are explained hereafter.
By default, the Forecaster processes the latest available forecast. However, it can also process a forecast for a given day in the past, provided the NWP outputs are available locally or remotely, or it can be executed to process the last x days. These options can also be executed once a day by a task manager to fill eventual gaps in the previous days. If the forecasts are already present, no computing resources are used.
A batch file can be provided to the GUI or the CLI. It contains the data and export paths as well as the analog methods to be applied (defined themselves in the xml parameter files). Automatic tasks can thus execute the Forecaster successively with different options, for example, for different regions. The results can be saved in different directories, or the same ones.
Requirements
The Forecaster needs:
Outputs
The Forecaster produces compressed NetCDF files containing:
The values of the predictand for the different lead times
The analog dates
The values of the analogy criteria
The target dates (lead times)
The number of analogs for the different lead times
Some reference values (e.g., precipitation for different return periods)
Some station metadata (ID, name, coordinates, height)
Some information about the predictors used along with the spatial windows
There is one file per variant of the analog method containing data for all stations of the database.
Some exports can also be generated (e.g. synthetic xml or csv files) to ease the integration of synthetic data on a web platform, for example.
The files are saved in a date-based directory structure (for example, 2019/04/23). The Viewer follows the same rules to look for new forecasts automatically. The output directory can be synchronized by means of a file-sharing client to distribute the forecasts.
Graphical user interface
This tool allows to do the following actions:
Process the latest forecast or for a given date
Define the list of methods to be performed automatically (also in command line mode)
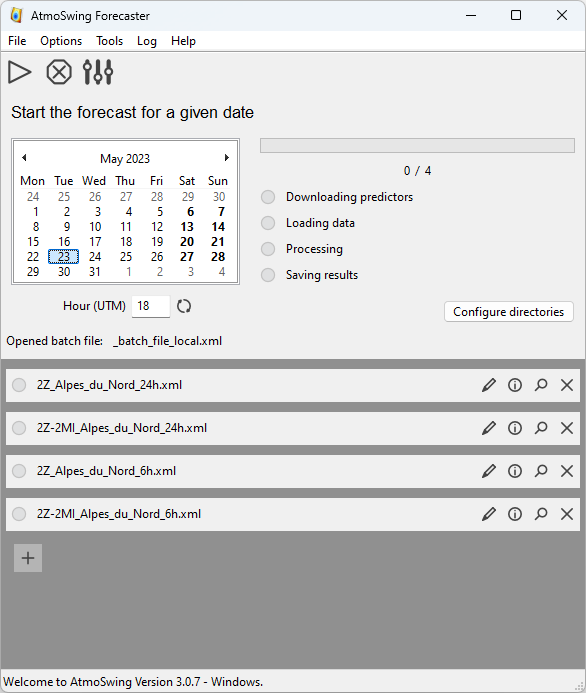
The toolbar allows the following actions:
 Run the forecast for the chosen date and time.
 Stop the current calculations.
 Define the preferences.
To perform a forecast, one must:
Choose the date from the calendar and the time below. When the software is started, the date and time are set to the current values. The
 icon allows updating to the current values.
Start the forecast calculation by clicking on the
icon in the toolbar.
The processed analog methods are those listed in the lower half of the interface. The methods can differ in terms of structure or parameters, for example, to be adapted for a subregion. The methods are executed one after the other. A ![]() icon means that the model is being processed,
icon means that the model is being processed, ![]() that the calculations have been successfully performed and
that the calculations have been successfully performed and ![]() that the forecast has failed for this method.
that the forecast has failed for this method.
Define the list of methods
The list of analog methods can be completed, or methods can be deleted. A method here is a specific parameterization of an analog method optimal for a lead time or a region. It is represented in the graphical user interface by choice of a parameters file. An entry can be removed with the ![]() icon, and new ones can be added using the
icon, and new ones can be added using the ![]() icon below the list.
icon below the list.
The entries can be edited by clicking on the ![]() icon. A dialog box appears to set the parameters file name (only the name, not the full path). The parameters file must be located in the directory defined in the preferences. It is an XML file that can be edited with a text editor. The structure of the file is described in the parameters file section. If the file is not found, the
icon. A dialog box appears to set the parameters file name (only the name, not the full path). The parameters file must be located in the directory defined in the preferences. It is an XML file that can be edited with a text editor. The structure of the file is described in the parameters file section. If the file is not found, the ![]() icon is shown. The
icon is shown. The ![]() icon allows displaying the description of the parameters file in a tooltip. The
icon allows displaying the description of the parameters file in a tooltip. The ![]() icon allows displaying the content of the parameters file in a new frame (the content cannot be edited).
icon allows displaying the content of the parameters file in a new frame (the content cannot be edited).
Warning
When the list of methods has been modified and should be kept as default, it is necessary to save it (menu ‘File / Save batch file’); otherwise, the list will be reset at the software restart.
Command line interface
The Forecaster also has a command-line interface, which makes it possible to automate forecasts on a server. A scheduled task can then be added on a server (ex: Task Scheduler on Windows or Cron task on Linux). The options are as follows:
- -h, --help
Displays the help of command-line options
- -c, --config
Configure the forecaster
- -v, --version
Displays the software version
- -f, --batch-file=<file>
Batch file to use for the forecast (full path)
- -n, --forecast-now
Run forecast for the latest available data
- -p, --forecast-past=<nb_days>
Run forecast for the given number of past days
- -d, --forecast-date=<YYYYMMDDHH>
Run forecast for a specified date
- -l, --log-level=<n>
Set the log level (0: minimum, 1: errors, 2: warnings (default), 3: verbose)
- --proxy=<host[:port]>
Use proxy on given port
- --proxy-user=<user[:password]>
Proxy user and password
Docker image
A Docker image is available on DockerHub: https://hub.docker.com/r/atmoswing/forecaster
Get it with: docker pull atmoswing/forecaster
The docker container for AtmoSwing Forecaster uses the same options than the command line interface (to the exception of the --config option). However, different directories need to be mounted in the docker container to allow AtmoSwing accessing the data and saving outputs.
The recommended way to use the docker container is to create a docker-compose file. An example is provided below:
version: "3"
services:
atmoswing_forecaster:
   container_name: forecaster
   image: "atmoswing/forecaster:latest"
   working_dir: /app/home
   user: "1000:1000"
   volumes:
      - /home/atmoswing/:/app/mount/
      - /home/atmoswing/scratch/home:/app/home/
      - /home/atmoswing/scratch/tmp:/tmp/
   command: -f /app/mount/params/batch-file.xml -n
   environment:
      HOME: /app/home
      ECCODES_DEFINITION_PATH: /usr/share/eccodes/definitions
   network_mode: bridge
Then, the batch file needs to contain the mounted directories in the docker container. If you changed the target directories above, you need to adapt them below as well. The batch file should look like:
<?xml version="1.0" encoding="UTF-8"?>
   <atmoswing version="1.0" target="forecaster">
   <forecasts_output_directory>/app/mount/forecasts</forecasts_output_directory>
   <exports_output_directory>/app/mount/forecasts</exports_output_directory>
   <parameters_files_directory>/app/mount/params</parameters_files_directory>
   <predictors_archive_directory>/app/mount/predictors/archive/NR1</predictors_archive_directory>
   <predictors_realtime_directory>/app/mount/predictors/realtime/GFS</predictors_realtime_directory>
   <predictand_db_directory>/app/mount/predictands</predictand_db_directory>
   <export_synthetic_xml>0</export_synthetic_xml>
   <forecasts>
      <filename>2Z_Alpes_du_Nord_24h.xml</filename>
      <filename>2Z-2MI_Alpes_du_Nord_24h.xml</filename>
      <filename>2Z_Alpes_du_Nord_6h.xml</filename>
      <filename>2Z-2MI_Alpes_du_Nord_6h.xml</filename>
   </forecasts>
</atmoswing>